| Model | RMSE (log) | Approx. Error (%) | MAE (log) | R-squared |
|---|---|---|---|---|
| M7: + Neighborhood FE | 0.4223 | 52.5 | 0.2734 | 0.6216 |
| M5b: + Spatial | 0.4437 | 55.8 | 0.2974 | 0.5822 |
| M4: + Census | 0.4554 | 57.7 | 0.3088 | 0.5597 |
| M3: Structural Only | 0.5369 | 71.1 | 0.3948 | 0.3882 |
Philadelphia Housing Price Prediction
A Predictive Modeling Framework to Support Property Tax Assessment
2026-03-17
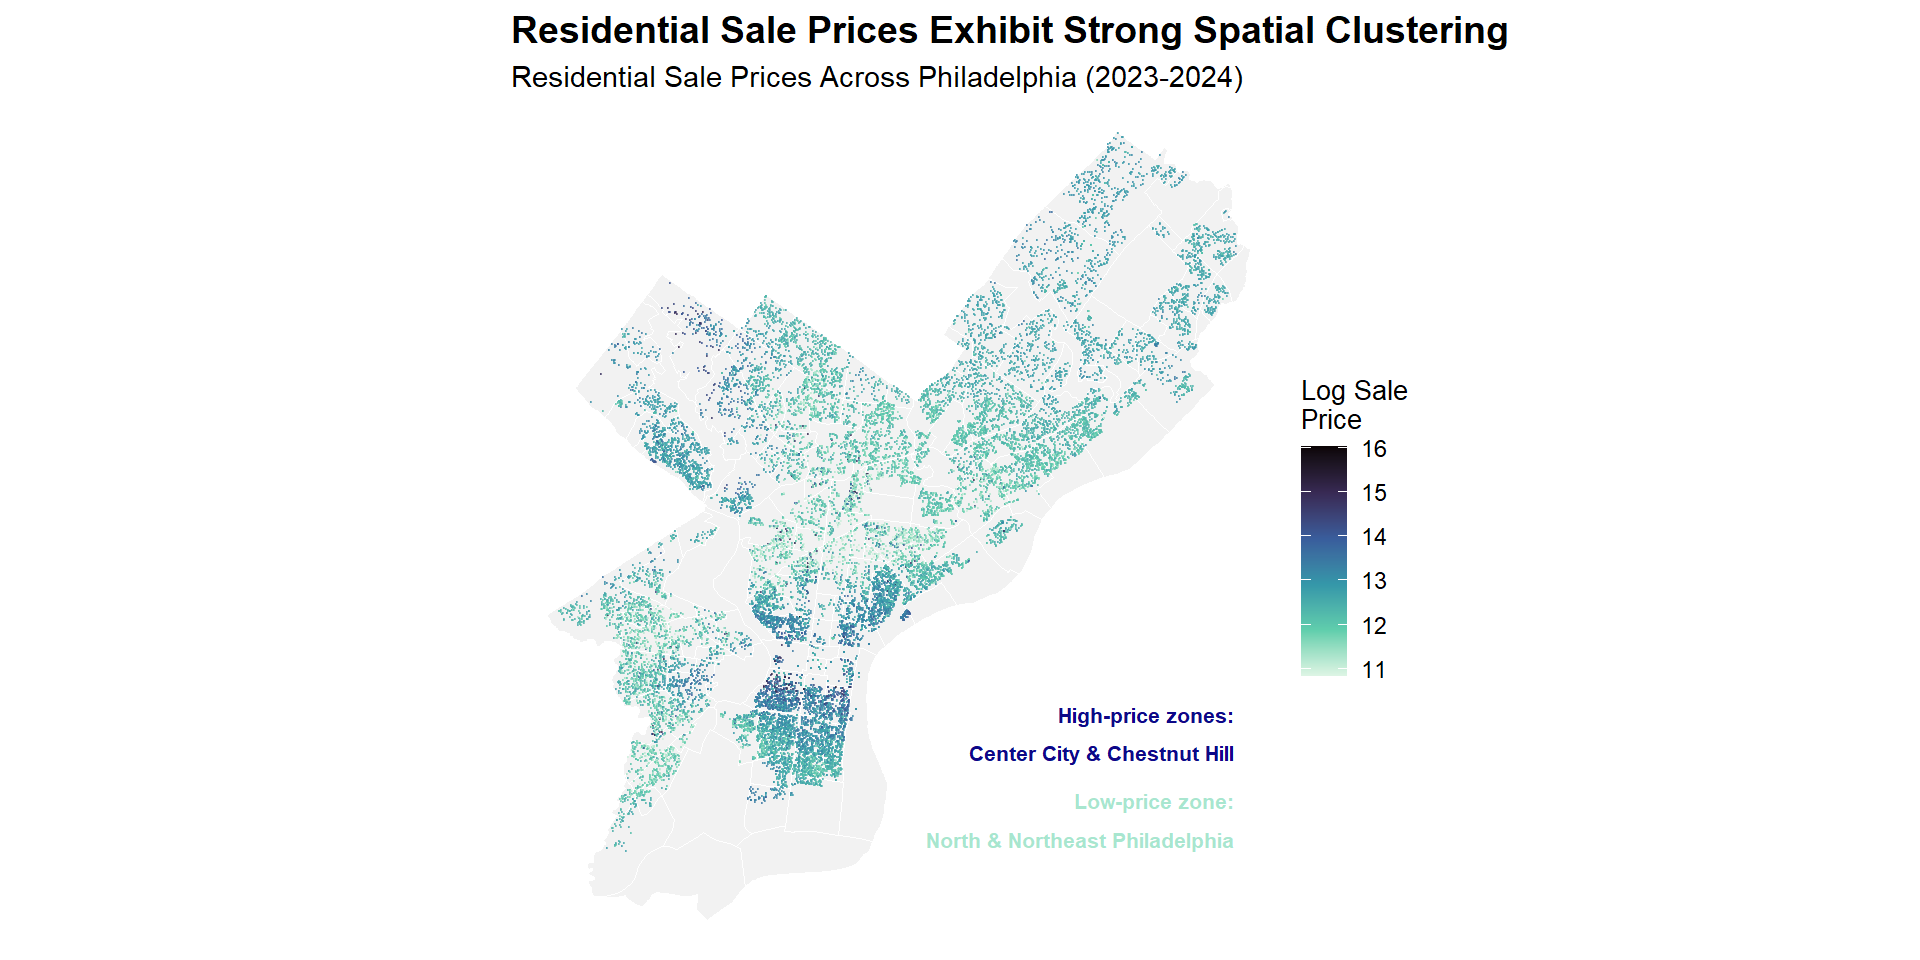
Spatial Distribution of Residential Sale Prices
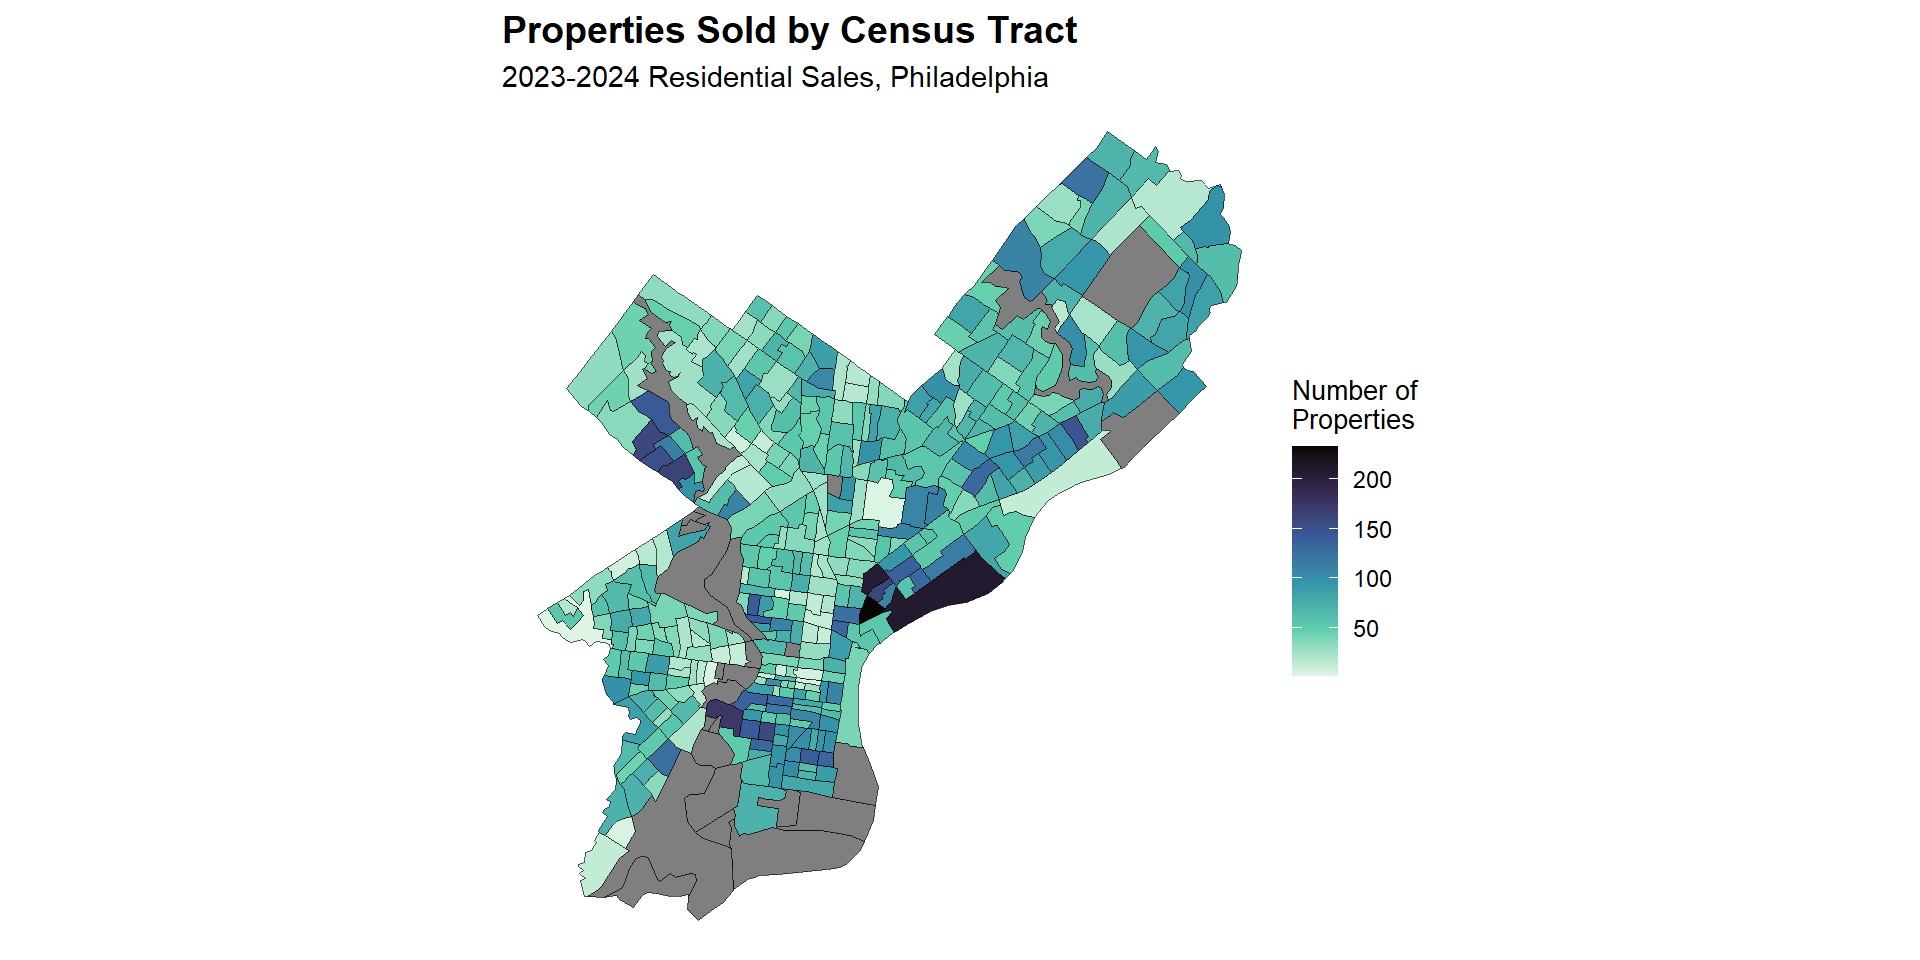
Properties Sold by Census Tract
Key takeaways:
- Sales are unevenly distributed across census tracts, with market activity concentrated in a limited number of neighborhoods and much thinner transaction coverage in others.
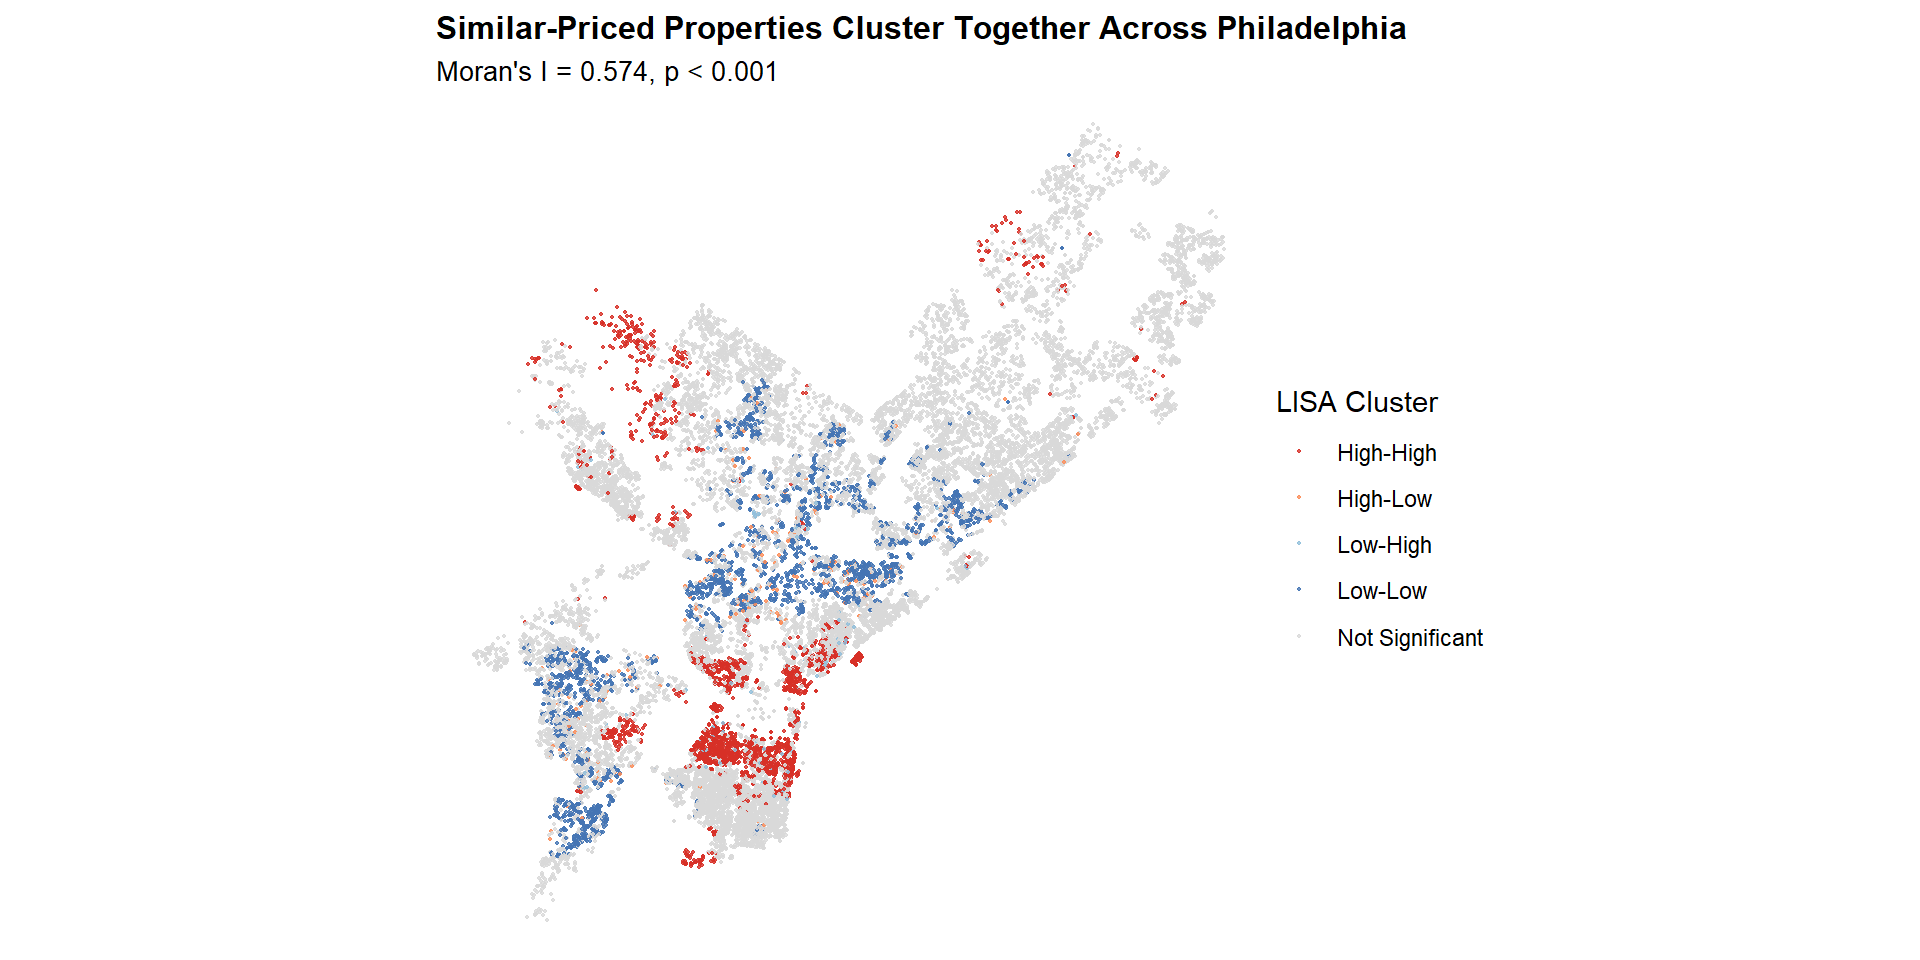
Spatial Autocorrelation of Sale Prices
Key takeaways:
High-High clusters concentrate in Center City and Chestnut Hill, with smaller clusters in Far Northeast, around UPenn, and the far southern tip.
Low-Low clusters dominate North and West Philadelphia.
The absence of significant autocorrelation at the boundary suggests an abrupt spatial discontinuity.
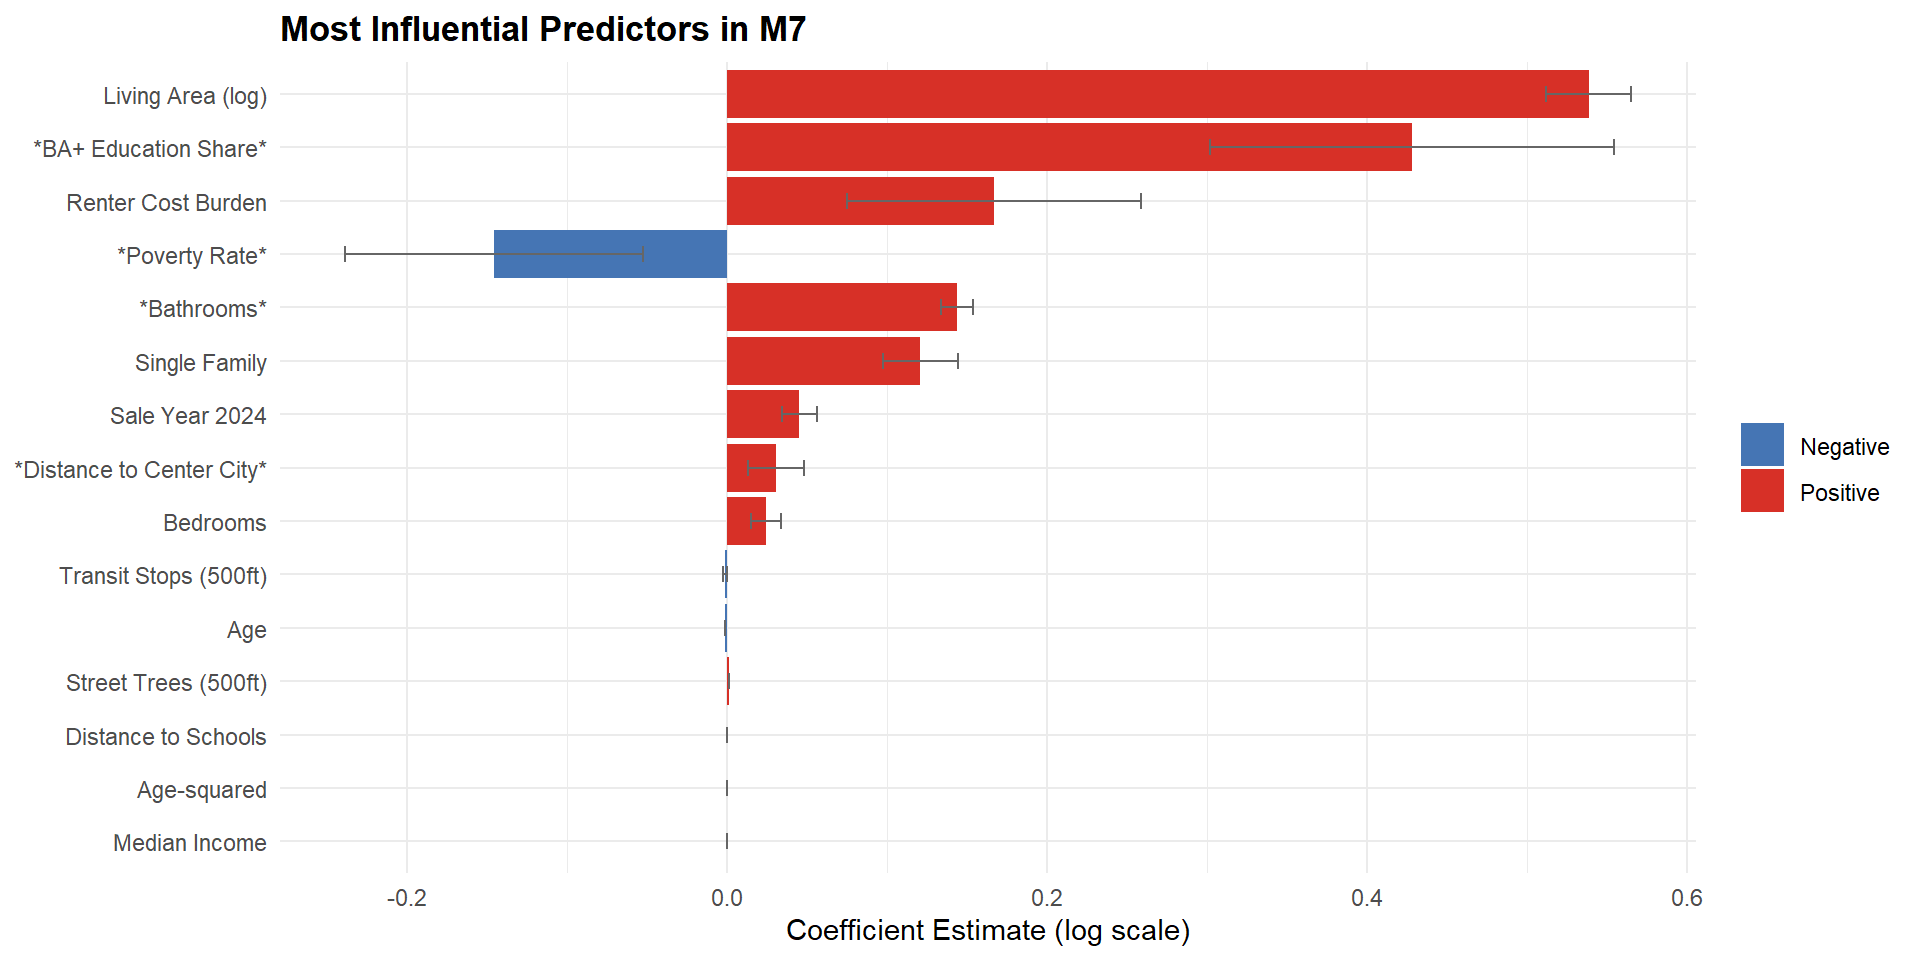
Most Influential Predictors
Key Takeaways:
Living area is the strongest single predictor
Socioeconomics outweigh amenities, confirming that who lives nearby matters more than what’s nearby.
Bathrooms signal overall quality.
Final Model Data Errors
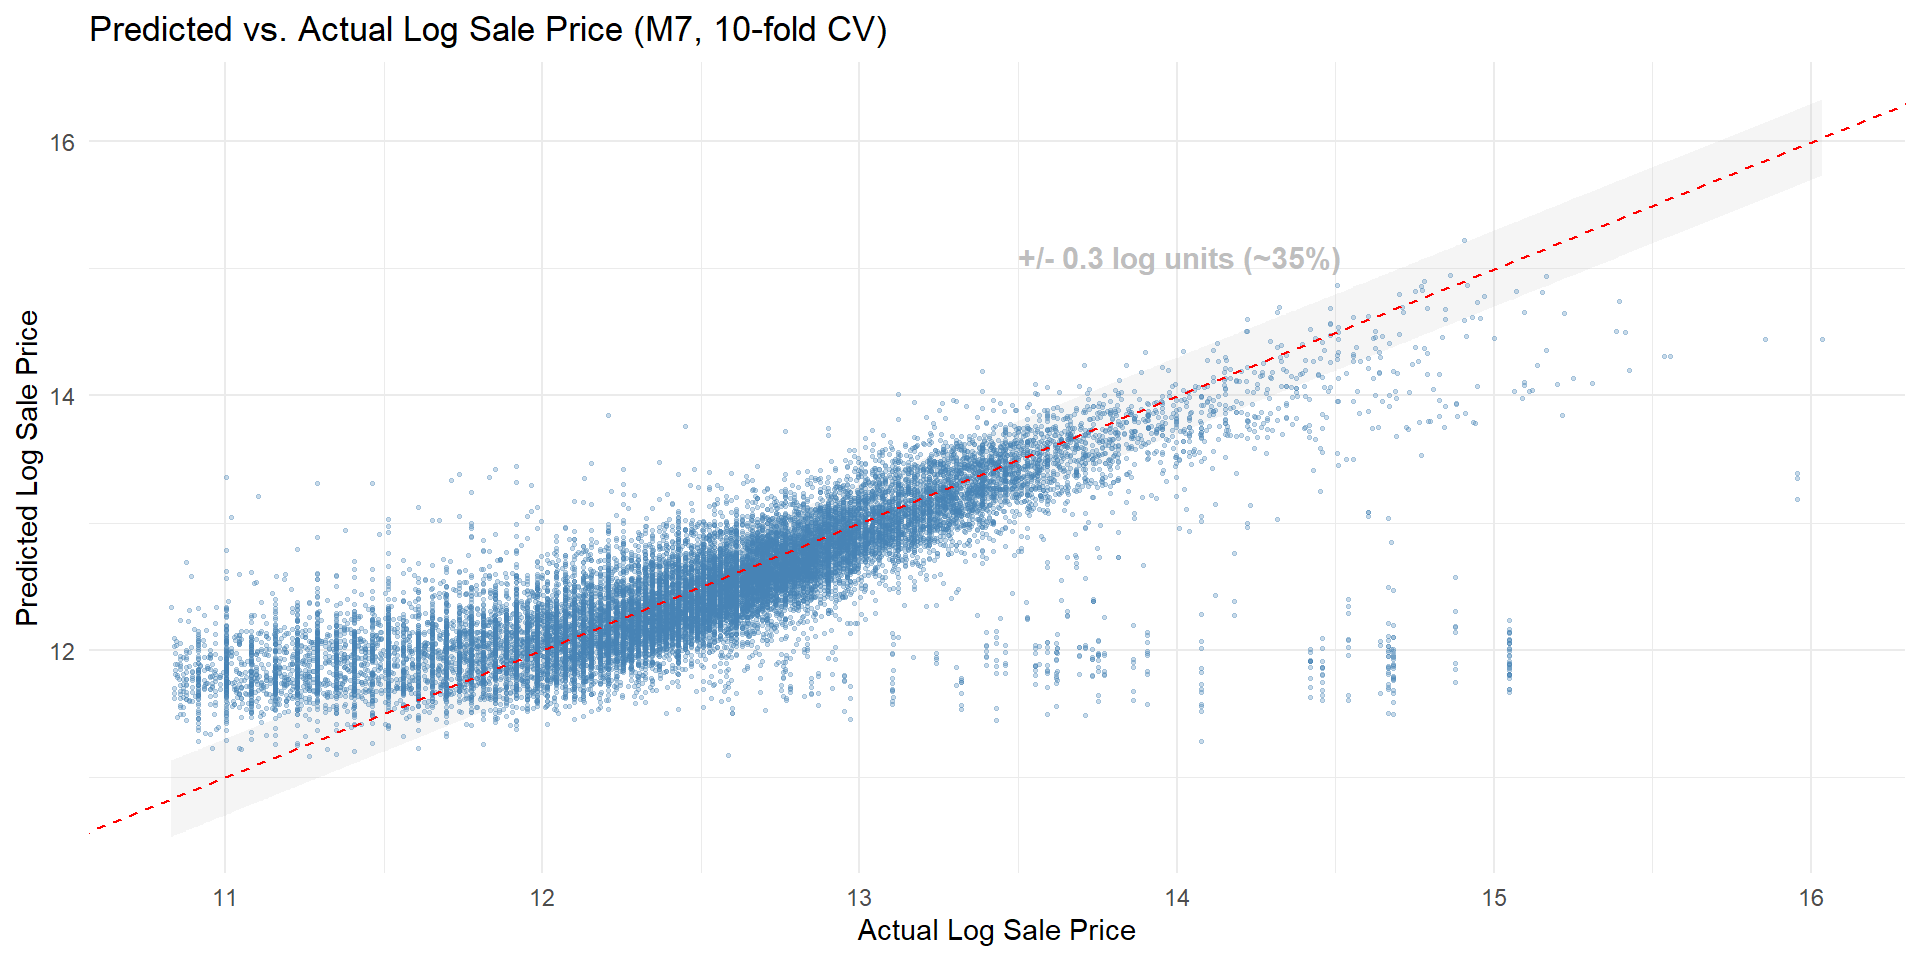
Note
M7 predicts mid-range prices well, but systematically overestimates low-price properties and struggles with luxury outliers: consistent with limited training data at the extremes.
Final Model Spatial Errors
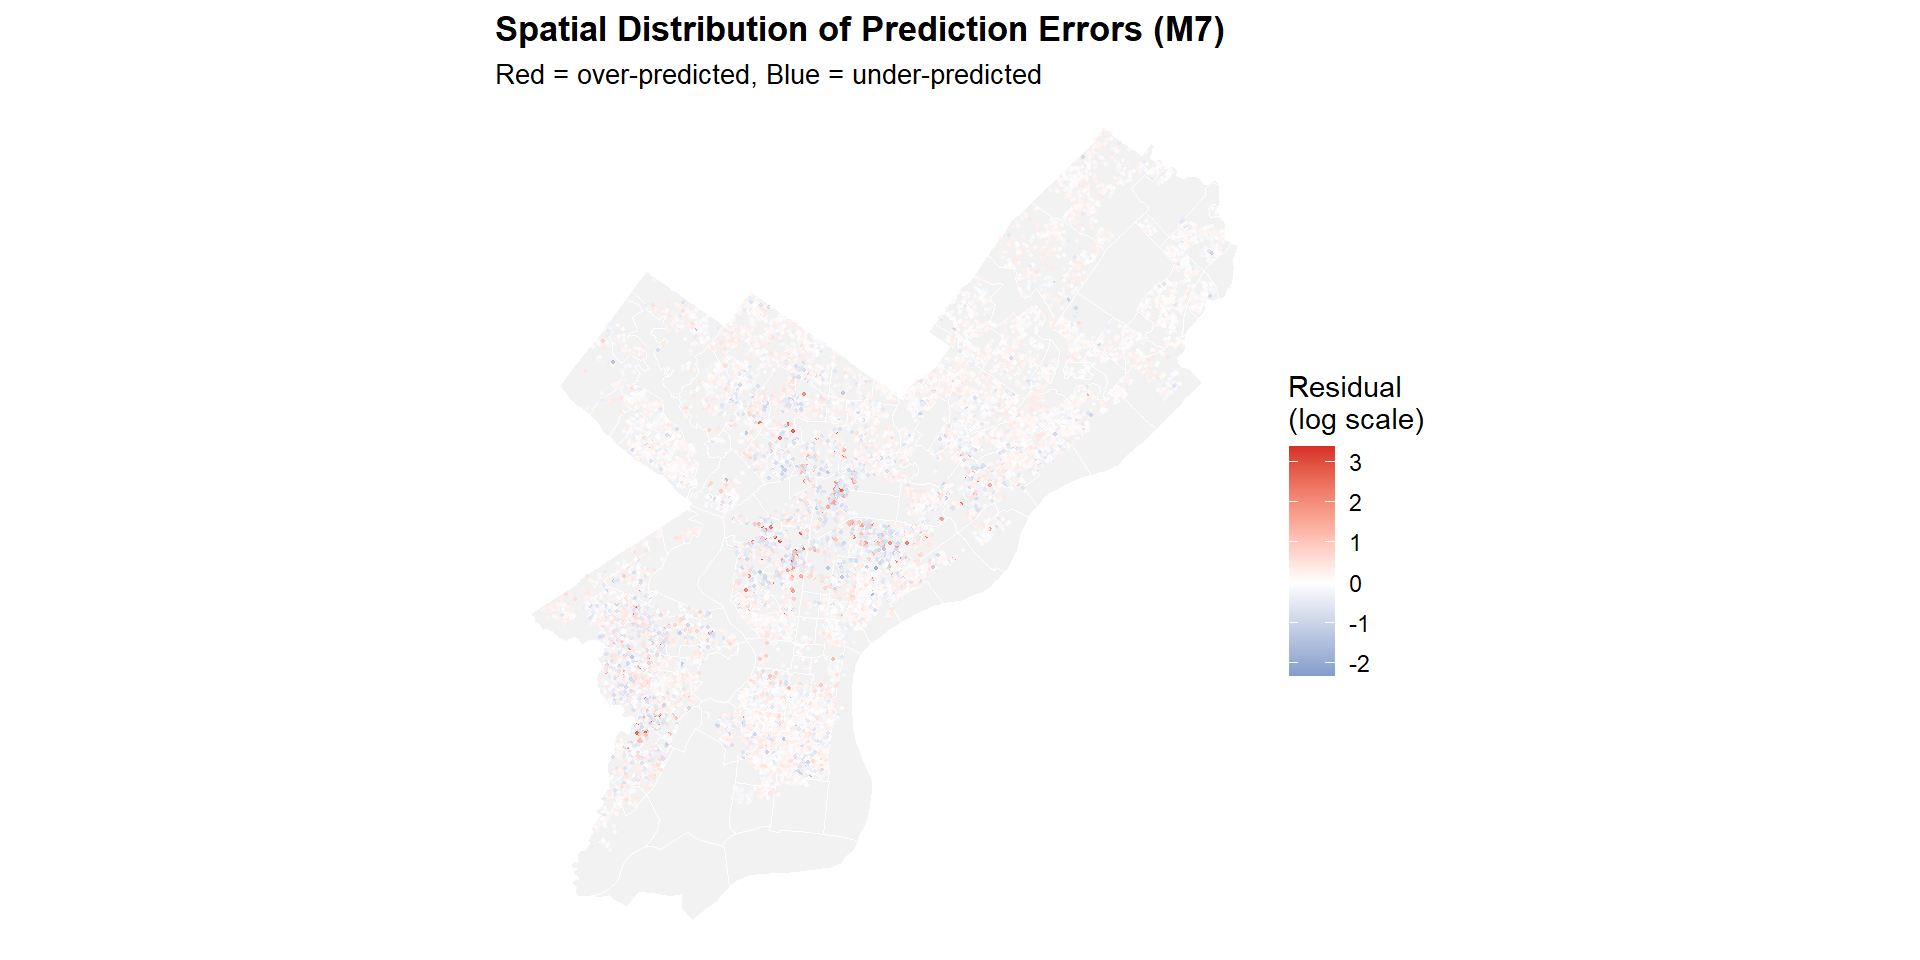
The residuals from m7 are relatively dispersed rather than forming large, continuous clusters, which suggests that the final model captures much of the broad spatial structure in Philadelphia housing market. At the same time, some localized market variation is still not fully explained.